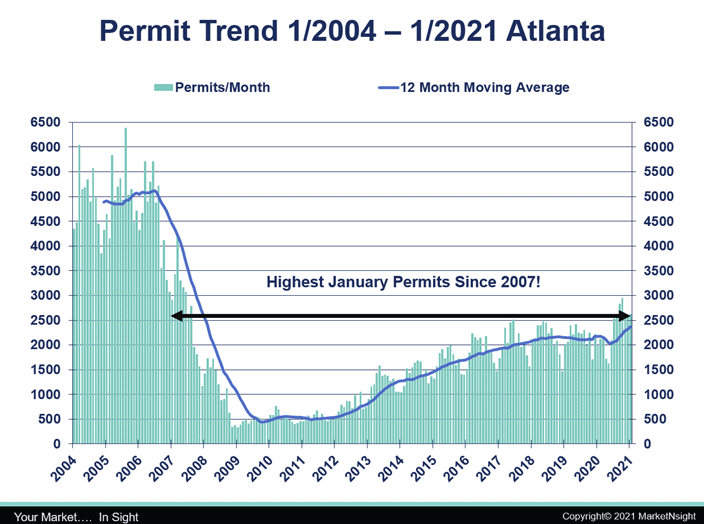
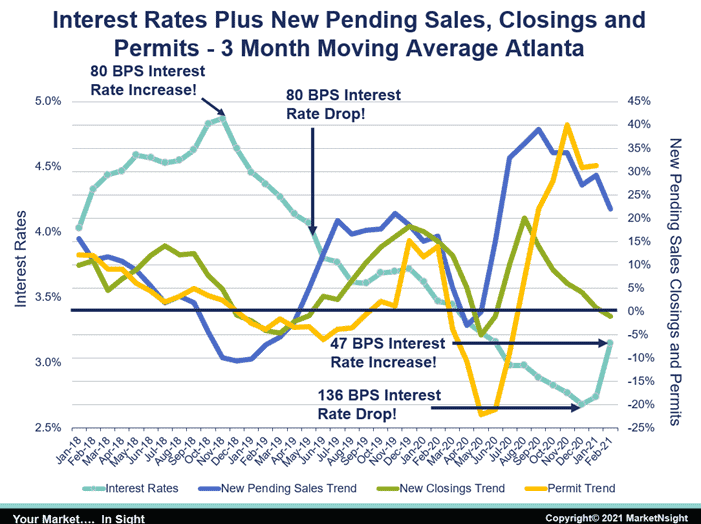
MarketNsight recently released its first housing report regarding 2021 Atlanta housing year-to-date. Data shows the roles of closings and pendings reversed with closings dropping first following by pendings, but record-breaking permits continued into January 2021 with the highest seen since January 2007, suggesting that new supply is coming.
“We have seen sharp moderation for both new and resale beginning in the first week of February 2021,” MarketNsight and ViaSearch President John Hunt said. “Is this due to our unprecedented lack of inventory, ever-increasing input costs, or the recent rise in interest rates? It may be a mix of all of these issues.”
From December 2020 to February 2021, 30-year mortgage rates increased 47 basis points. According to Hunt, the decline in demand that occurred at the same time is not a coincidence.
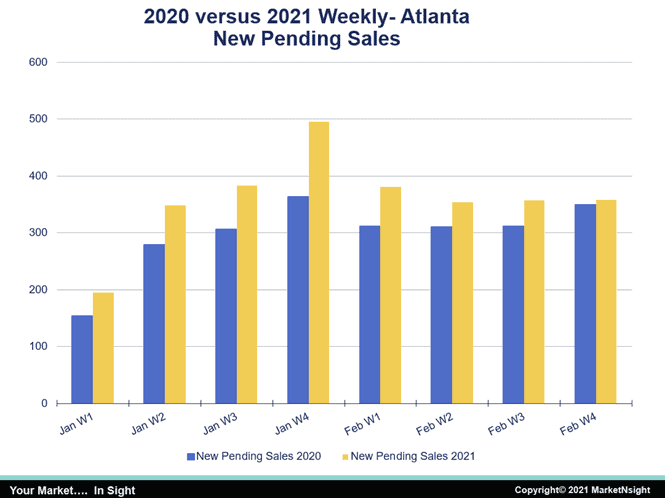
Additionally, the number of weekly COVID-19 (coronavirus) cases in Georgia have been plummeting, nearly returning to June 2020 levels, and new home pending sales have been positive year-to-year for all of January and February.
“The next few weeks will be interesting as we compare this year to the pandemic collapse of 2020,” Hunt said. “We were negative from the second week of March 2020 to the third week of April 2020 – six weeks in total. We should see major gains year-to-year in that time span.”
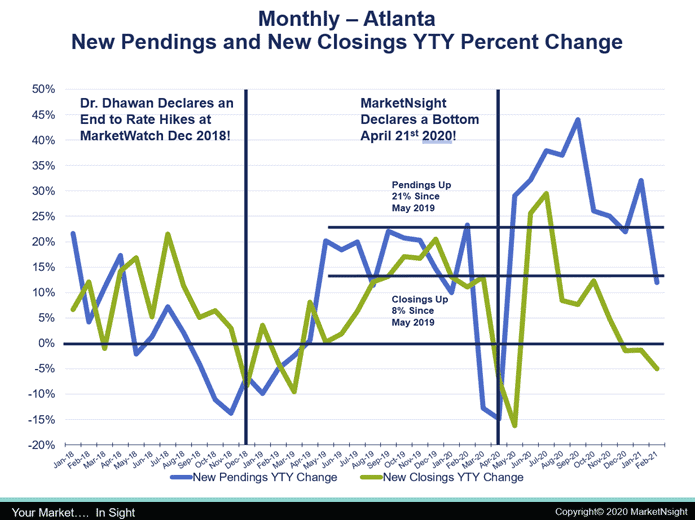
According to MarketNsight data from January 2018 to July 2020, closings followed pending sales, but beyond that time range, the roles of closings and pendings reversed with closings dropping first and pendings following suit. Is this a reflection of declining demand or lack of supply?
“Most of the cities in a 250-mile radius around Atlanta have not seen the same drop in pendings or closings,” Hunt said. “That certainly points to the constraints on supply that we face in Atlanta in terms of entitlement, zoning and generally higher development costs.
“You have to have something to sell. Some good news is that permits in the last half of 2020 hit records not seen since 2007, and January 2021 continued that trend with the highest permits compared to that same period.”
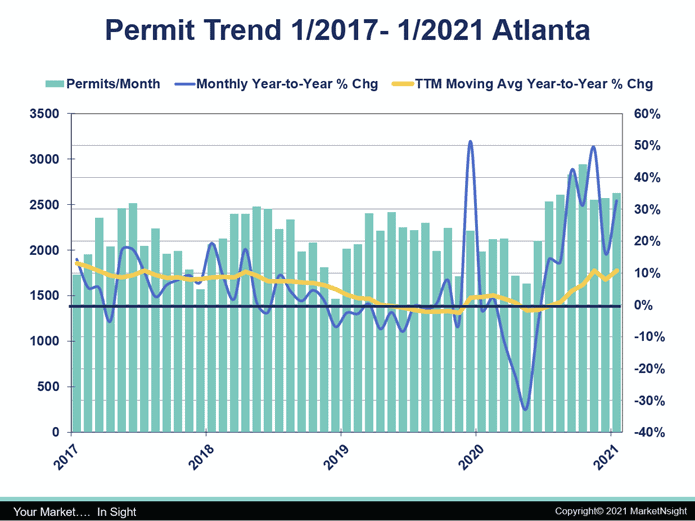
Permits in 2020 were up 6% compared to 2019, falling just short of the 10% increase forecasted by MarketNsight.
“We started 2021 off with a 35% increase over 2020, and our forecast still calls for permits in 2021 to be up 12% to 15% over last year,” Hunt said. “The only constraint is our ability to supply product at the right price point for the location being considered.”
Regarding total new home sales in 2020, closings were up 6% over the previous year, and the recent sharp increase in permits should help alleviate the supply shortage somewhat. Hunt predicts 2021 closings could be up 10% or more compared to last year.
“As I have said before, I believe the acute lack of supply will be with us for a long time,” Hunt said. “We just cannot make up for it with new construction only, and we cannot force existing homeowners to list their homes, which would help on the supply side.
“As the rest of the economy finally begins to see improvement, rates will continue to rise, but we think the 30-year fixed will stay at or below 4% for the next few years at least.”
Interest rates will eventually rise, and homeowners will feel confident in listing their homes, which will create more competition for new home sales. Now is the time to excel in the marketing basics: price, product, place and promotion.
MarketNsight is focused on helping home builders and developers make smart decisions related to purchasing land and pricing product. Its groundbreaking Feasibility Matrix® systemizes the decision-making process and creates a one-stop-shop for gauging new home community feasibility including ranking by builder and subdivision and developed lot and raw land sales.
To learn more or to schedule a demonstration, visit www.MarketNsight.com.

