
So Much for the End of the Housing Boom: MarketNsight offers an abbreviated update for the month of August.
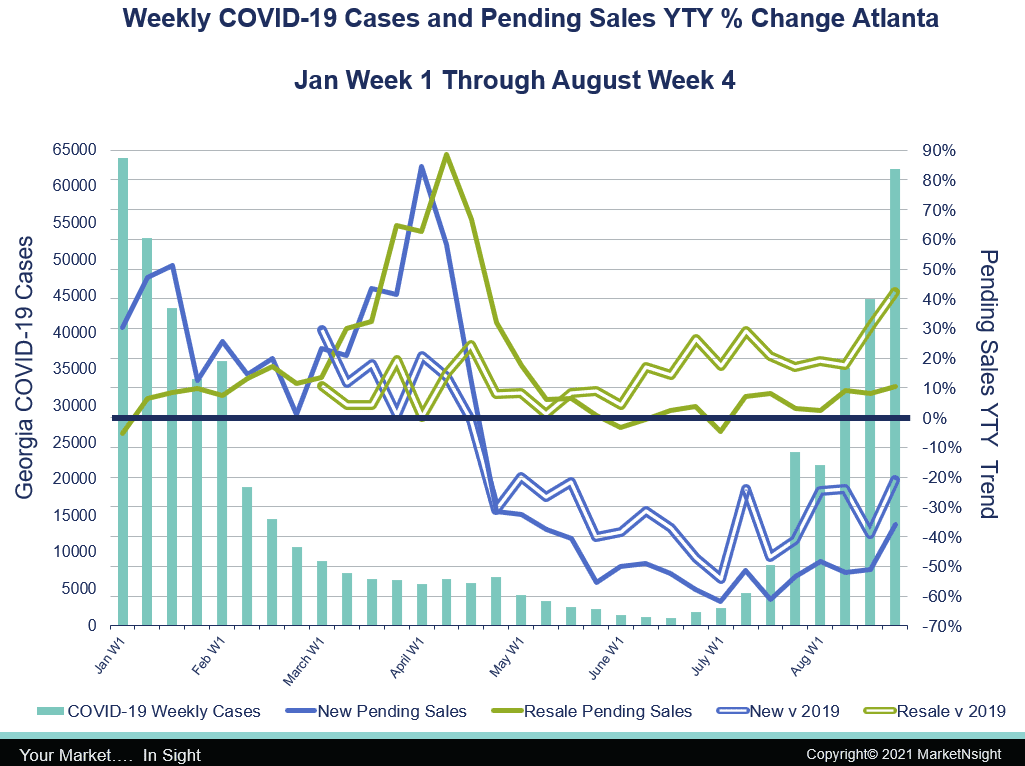
According to MarketNsight Principal John Hunt, July trends continued as resale pending sales were up in the last week of August more than 40% over the same period in 2019, and even up 10% over an incredible 2021 (See chart 1 below). The pending sales inflection in May happened in all 35 markets of MarketNsight serves and coincides with the first increase in inventory since the pandemic boom began (See chart 2 below below). You must have SOMETHING to sell!
It appears that new home pending sales may have found a bottom in July. Anecdotally, MarketNsight finds that some builders are becoming more comfortable writing presales and releasing specs at an earlier stage. Remember that the decline in new pending sales happened almost simultaneously across the US. This was a major factor in the dramatic decline in lumber futures.
Total Inventory Versus Deficit
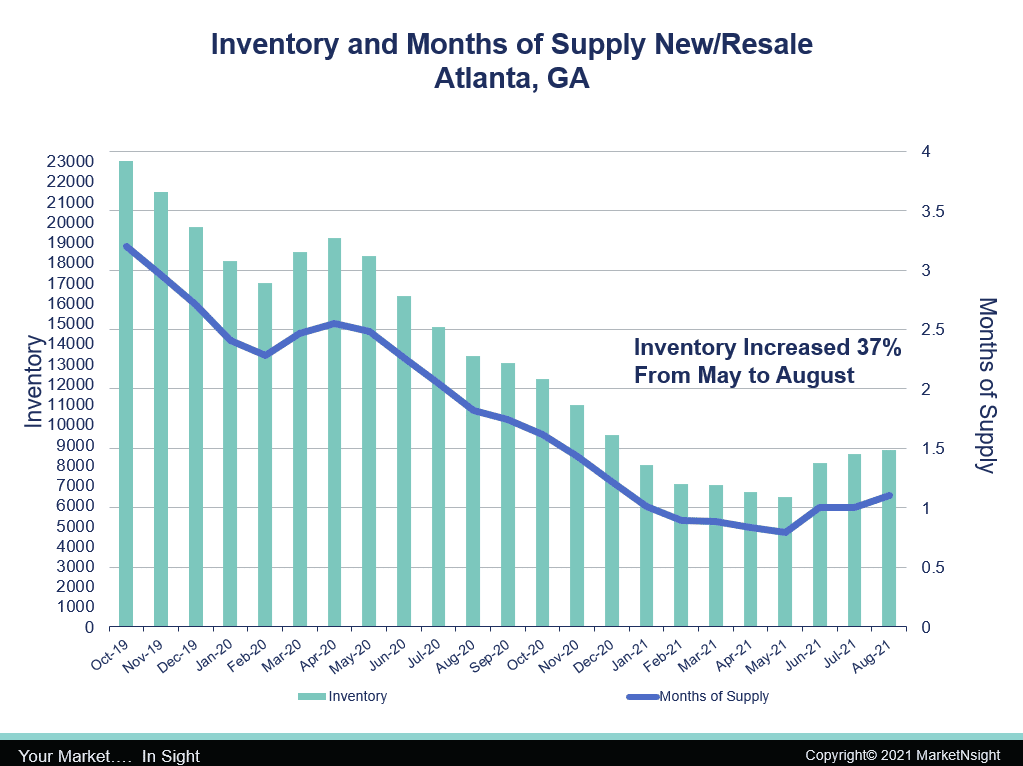
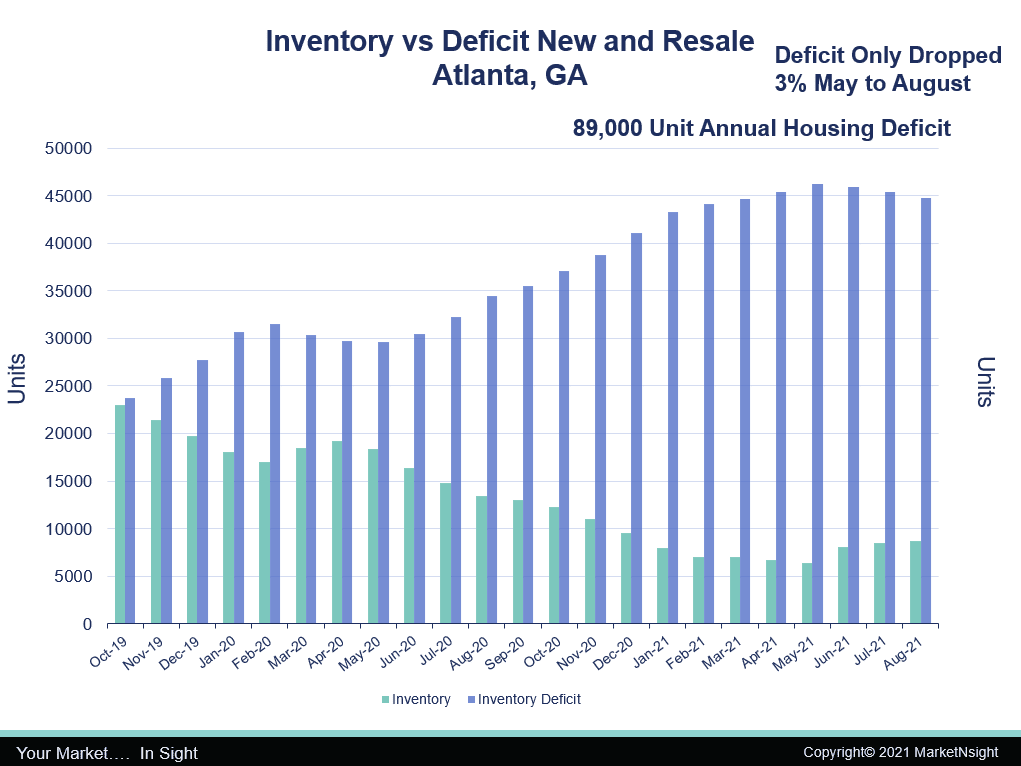
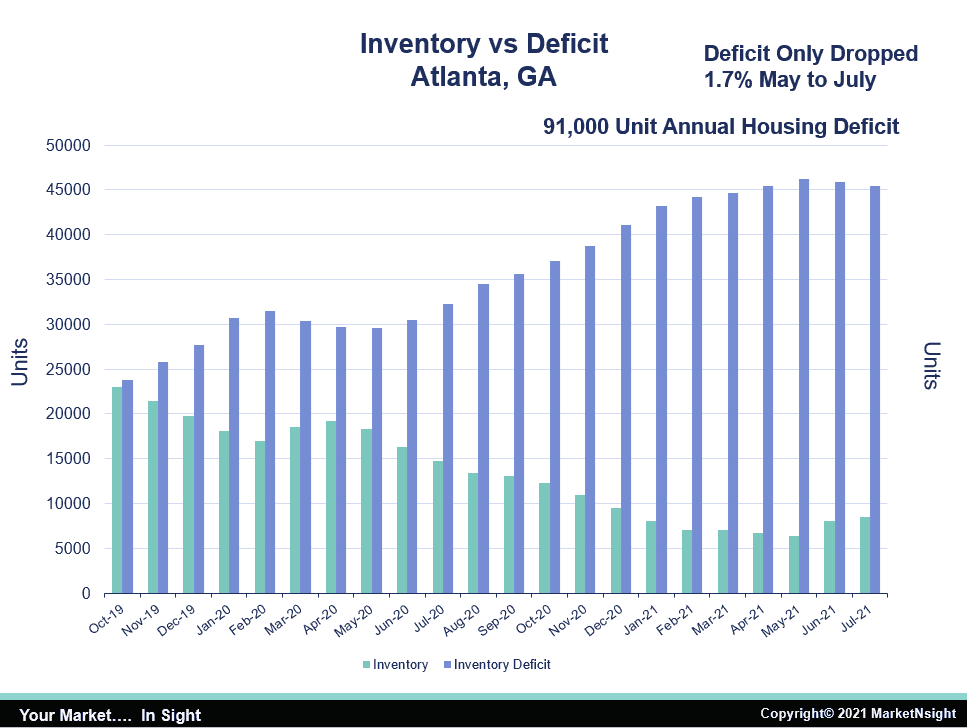
As mentioned above, all markets saw an increase in inventory after May. Inventory in Atlanta has increased 37% since bottoming in May (See chart 2 below). Although this was a much-needed increase in inventory, it only resulted in a 3% drop in the massive housing deficit that our city is facing (See chart 3 below).
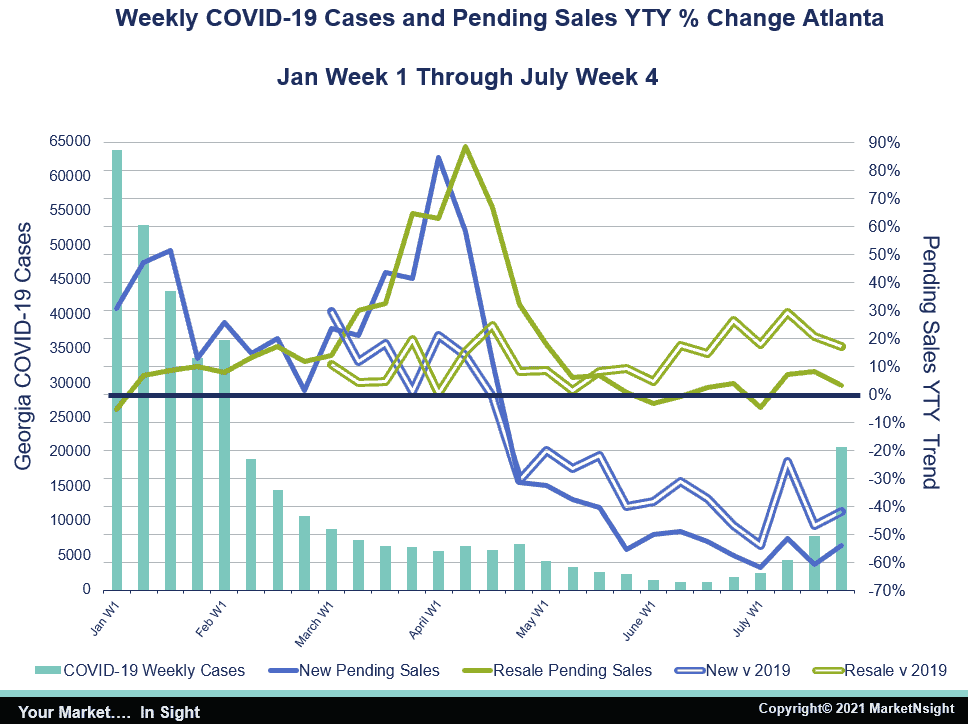
Here is the July Report
Is the housing boom over? First, according to MarketNsight Principal John Hunt, the national media is always AT LEAST a month behind in its reporting. Second, it usually misinterprets the meaning of the data anyway.
For example, the real reason for the decline in new homes is not mentioned in any of these articles, in spite of CNBC quoting DR Horton Chairman Donald Horton: “We have slowed our home sales pace…” According to Hunt, no article even touches on the fact a majority of builders across the nation have slowed sales down on purpose.
“I guess it is hard to believe builders would act rationally in the face of massive and unpredictable price increases in everything from lumber to paint, to windows, et al.,” Hunt said.
The MarketNsight team revealed this fact at its June 9, 2021, Atlanta MarketWatch event.
These are the results from the poll of over 800 industry professionals who attended the event:
Are supply chain difficulties affecting your abilities to sell homes?
- Yes – 73%
- No – 27%
Have you taken measures such as limiting/eliminating presales and releasing homes for sale only after framing stage or later?
- Yes – 70%
- No – 30%
If you are limiting presales and delaying the release of new homes, why?
- Unpredictable nature of current supply pricing – 58%
- Cannot keep up with the demand – 11%
- Both – 32%
Atlanta New Pending Sales YTY Change with COVID-19 Georgia Cases
The results of the poll can be seen in the chart below. The solid lines compare this year to last year, where March through May was horrible due to the government shutdowns. The hollow lines compare March through July of 2021 to the same period in 2019. All across the MarketNsight 35-city footprint, the bottom fell out for new pendings beginning in the last week of April as builders decided to throttle back sales. This is the data behind the negative headlines.
However, resale – the dominant component of housing demand at 80% – found a bottom in May and has been up since. Resale demand is rising when compared to a very good 2019 and even compared to a stellar 2020. This housing boom is far from over. Look for that good news to show up nationally in about a month. New construction is only down as a direct result of facing massive constraints on supply.
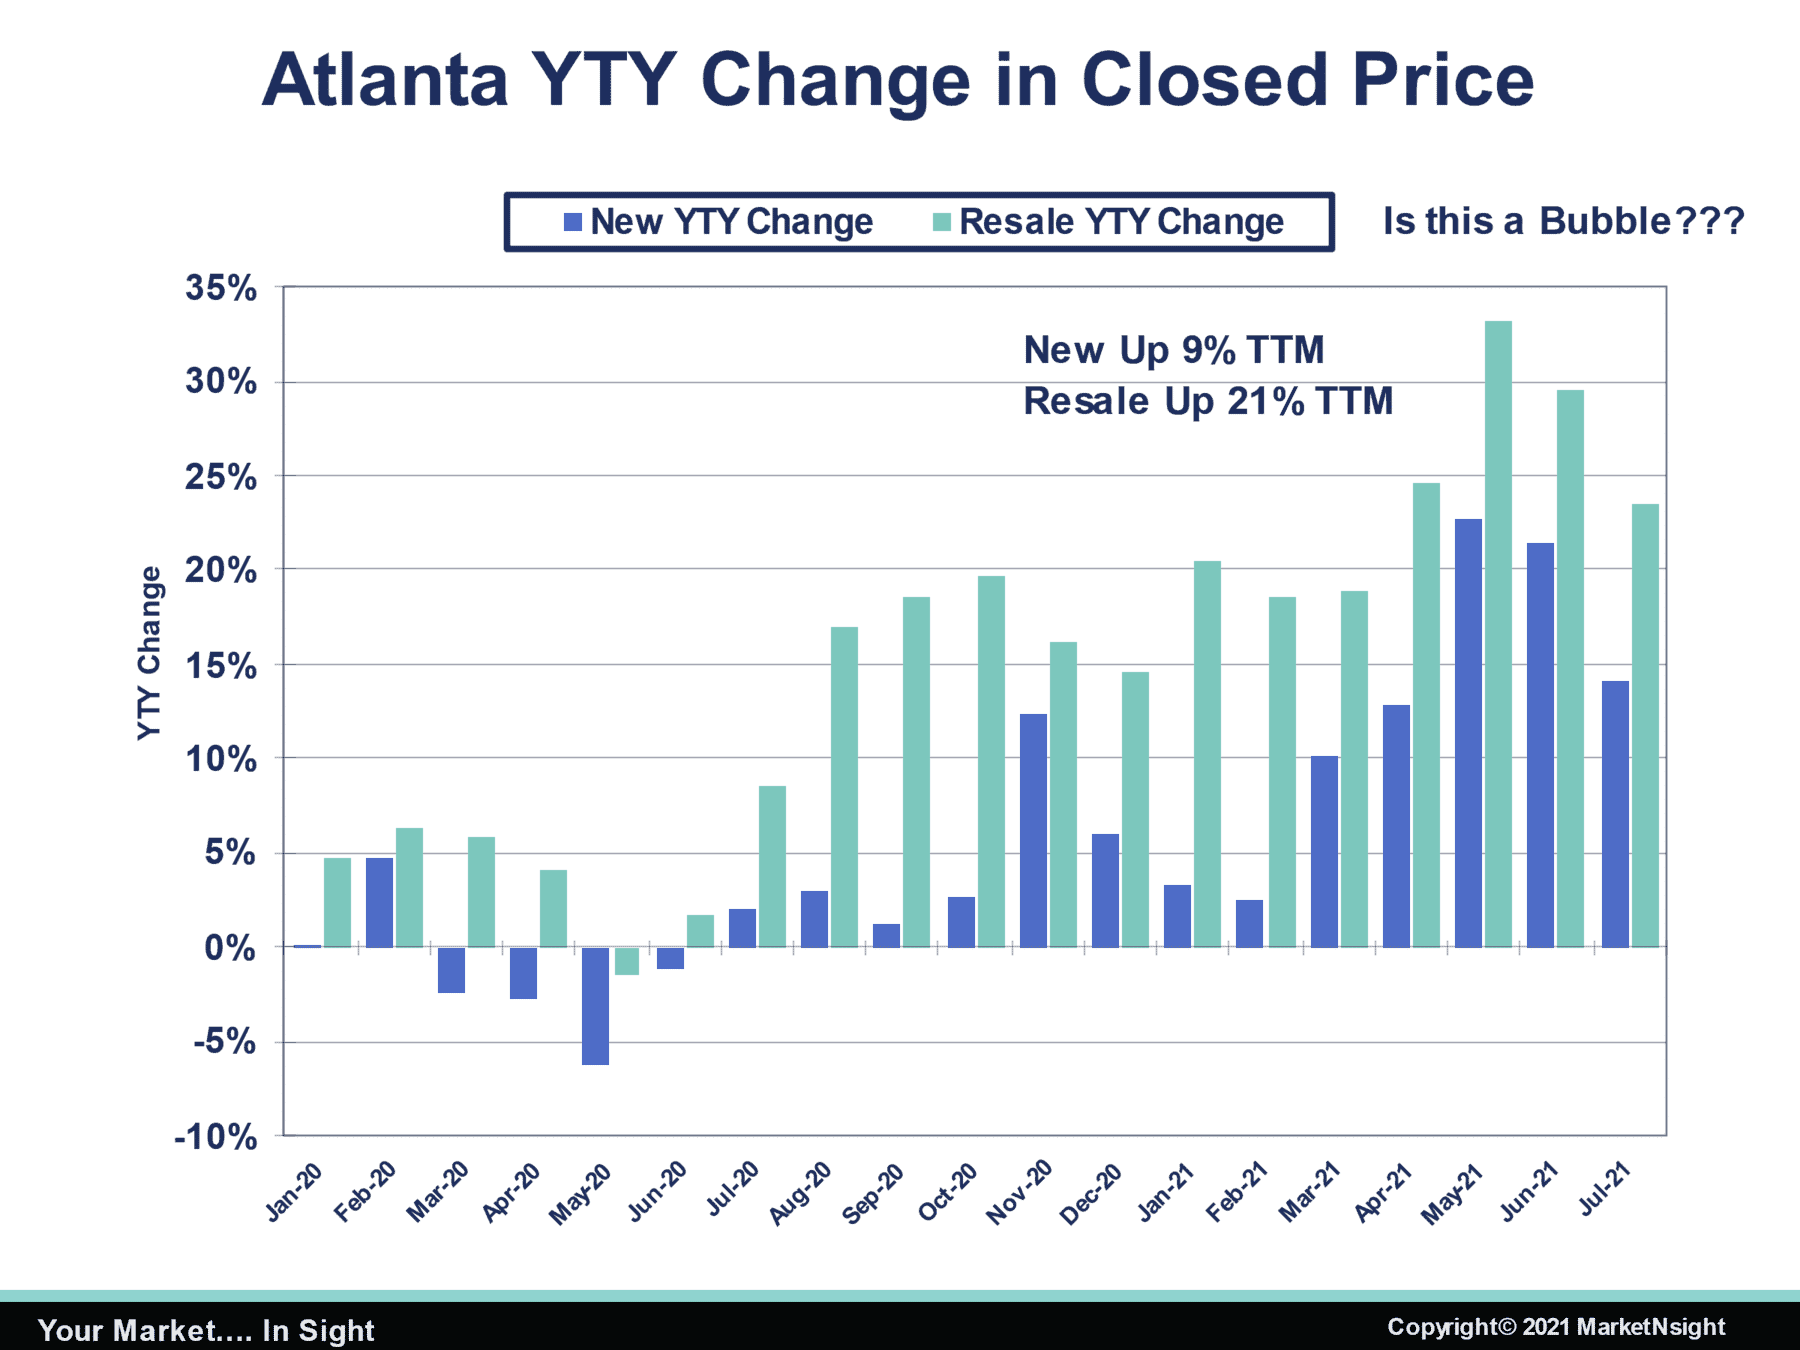
Are We in a Price Bubble?
It certainly looks like it from the chart below, especially for resale. According to Hunt, these resale price increases are unprecedented. Housing appreciates each year between 4 and 5% in normal times. These are not normal times. In fact, the last “normal” year for Atlanta was 2002 – 20 years ago. If you only look at the resale price increases over the last 12 months, it absolutely feels like a bubble but seen over a much longer arc of housing history, maybe it is not a bubble yet.
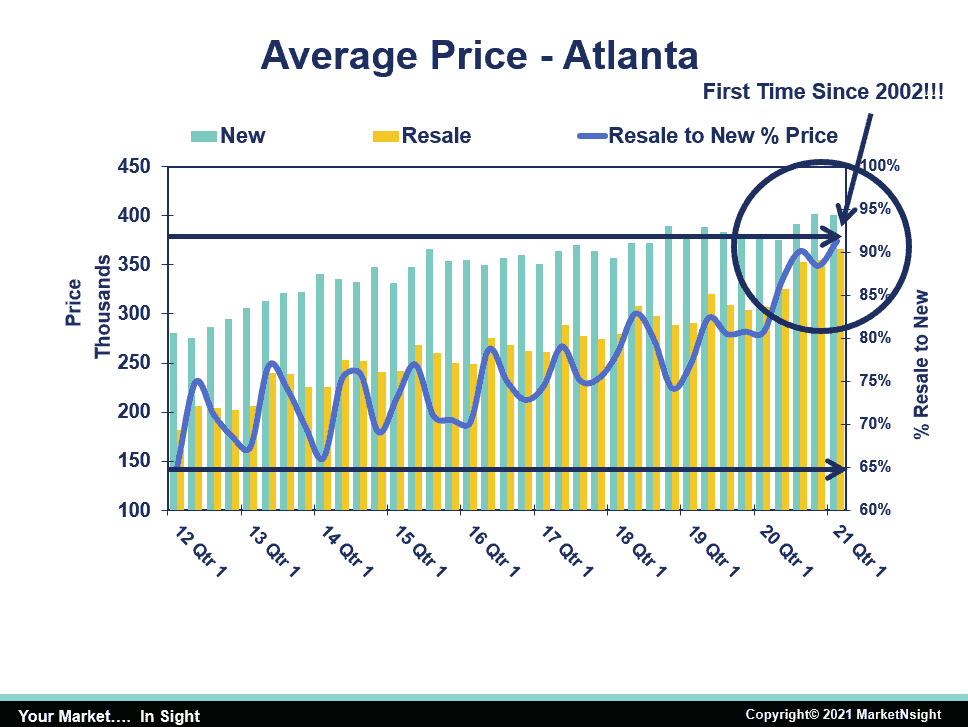
Housing’s Last “Normal” Year – 2002
Leading up to 2002, the same metrics had ruled for almost a decade, producing the same results year after year: a 10% new/resale price spread, 45,000 to 50,000 new permits, and a 40% market share for new against resale. After 2002, everything changed as subprime/Alt A loans flooded the marketplace. This resulted in an average lot price year to year increase of 15% for 2002 to 2007. That is three times the normal rate of appreciation for five straight years. The price spread between new and resale went above 20% for the first time in the third quarter of 2006. Most industry experts say that was the beginning of the end for new homes.
Carnage ensued and the industry did not find a bottom in housing until 2011 with a 65% new/resale price spread, 6,000 new permits and an 11% market share for new against resale. The good news: as of the first quarter of 2021, the new/resale price spread is back to about 10% (see chart below). This was only accomplished with the very high resale appreciation over the last 10 months. It just took 20 years to get back to that “normal.”
How About Another Reason We May Not Be in a Bubble Yet?
If you start with 2002 as a baseline and hypothetically appreciate new and resale median prices at 4.5% for 20 years, you find home prices are almost exactly where we should be over that 20-year span (see chart below).
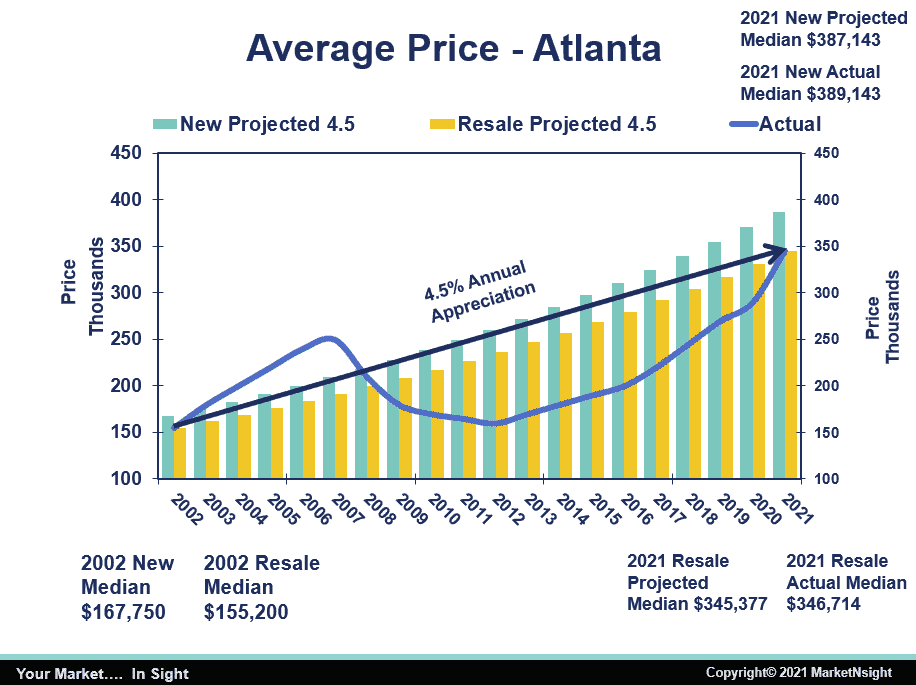
“Resale prices are starting to moderate and that should continue from here,” Hunt said. “If we do not see moderation, all bets on a price bubble are off.”
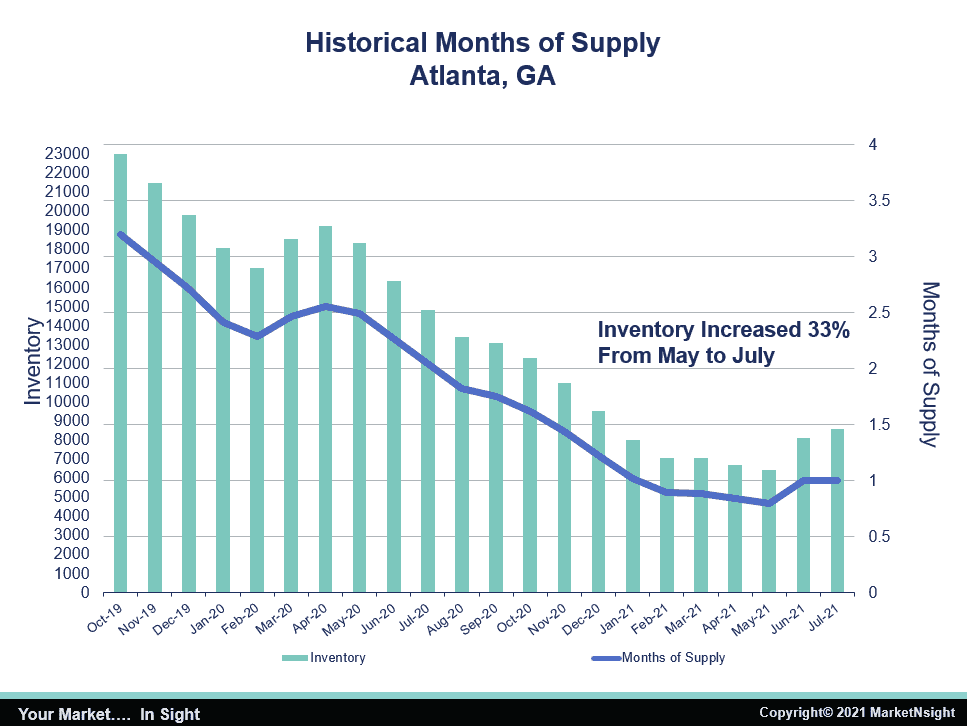
This Housing Shortage will Last for Another Decade at Least
How big is the hole dug in the last 20 years of under-building compared to population growth?
“The numbers are mind-blowing,” Hunt said. “I have been saying this since June 2020.”
Now, others are starting to agree, such as Goldman Sachs. The chart below shows inventory was dropping fast even before the pandemic. There was a slight pause during the shutdowns, and then demand accelerated, sucking all of the inventory out of the market through May of this year.
Finally, in June and July, every market saw the first increase in inventory since the pandemic started. Atlanta experienced a 33% increase in total inventory from May to July. While this inventory increase is the reason resale pending sales were up over the same time (you have to have SOMETHING to sell), the months of supply only went from 0.7 to 1, and one month of supply is where crazy things still happen, like buying homes sight unseen, foregoing appraisal contingencies and bidding wars.
A 33% increase in total inventory only dropped the total inventory deficit in Atlanta (91,000 units) by a mere 1.7%.
“If we want to really put a dent in the housing inventory deficit, we need more than a 33% increase in inventory,” Hunt said. “Builders will continue to build to try to meet this unmet need, thus the housing boom shall continue!”
The next MarketWatch Atlanta Event is scheduled for Thursday, December 9, 2021, with Rajeev Dhawan of the Georgia State University Economic Forecasting Center. Please make plans to be there virtually.
Ask Hunt questions about the housing boom or catch up with MarketNsight in-person or virtually before then by visiting the Events Page.