In 2018, MarketNsight was one of the first in the nation to sound the alarm on the effects of rising interest rates on housing; rates increased from 4% in January to 4.8% by October of that year. At the same time, new pending sales started dropping and went negative as rates peaked in October of that year. New pending sales stayed in negative territory until May of 2019 when rates fell back down to 4%. None of this was a coincidence.
From 2018 to 2019, there was a direct correlation between rising interest rates and declining housing demand, but that was then, and this is now.
Every Market Has a “Driver”
Analysts at MarketNsight argue the housing market has seen three distinct drivers since 2018, and each of these drivers has taken the market to a place it has never been before, a place where all the accepted rules have been broken. Did anyone really see the pandemic causing a massive housing boom?
“We forecast for a living, and we didn’t see that one coming,” John Hunt, principal with MarketNsight, said. “It would be a mistake to think that rising interest rates will necessarily lead to a massive housing decline in this unprecedented Zero Inventory Environment.”
Interest Rate Driven Market – 2018 and 2019
In 2018, inventory was plentiful compared to today. When rates rose 80 basis points from January to November of that year, the effective price increase and lack of urgency put some potential buyers on the sidelines and new construction housing demand dropped 10% year to year. The Fed reversed its tightening policy for 2019 and began to cut rates. By May of 2019, rates had dropped to 4% and demand flooded back in (see Chart 1).

Pandemic-Driven Market – 2020 through May 2021.
At the end of 2019, millennials – the sleeping giant – actually began buying en masse. After a two-month pause for the pandemic-related shutdown, they picked back up where they left off. Combined with the pandemic-created need for larger, more flexible spaces, this brought an unexpected explosion in demand for homes.
Supply (Or, Lack of Supply) Driven Market – June 2021 to Present
In only 12 months, from May 2020 to May 2021, we went from just over three months of supply to 0.7 months of supply (see chart 2). That is essentially the same as zero, as there are just some homes that will never sell.
“We have never been here before,” Hunt said. “Zero inventory is a huge game-changer. The demand is so high above our ability to supply that any effect from rising interest rates will probably be muted.”
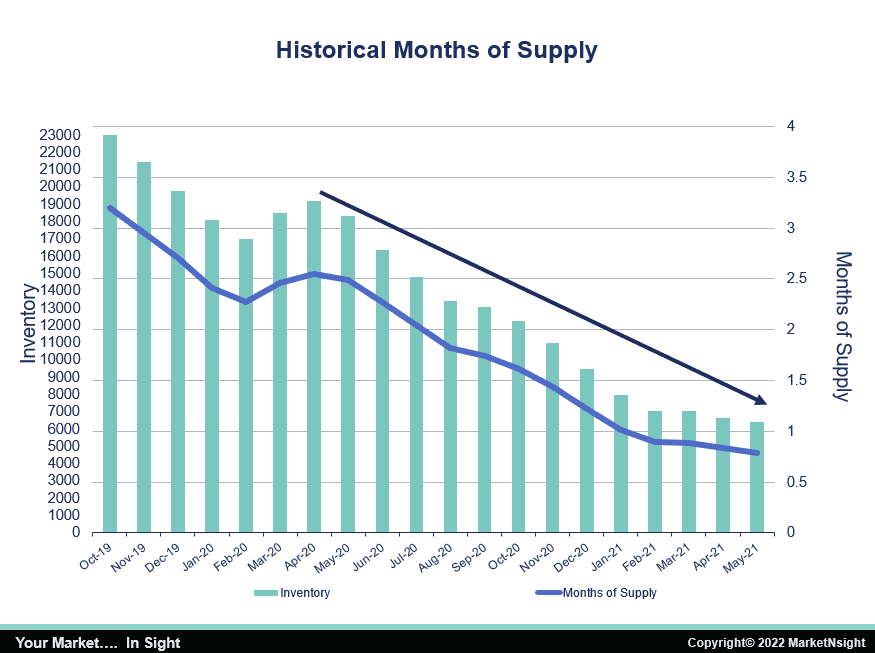
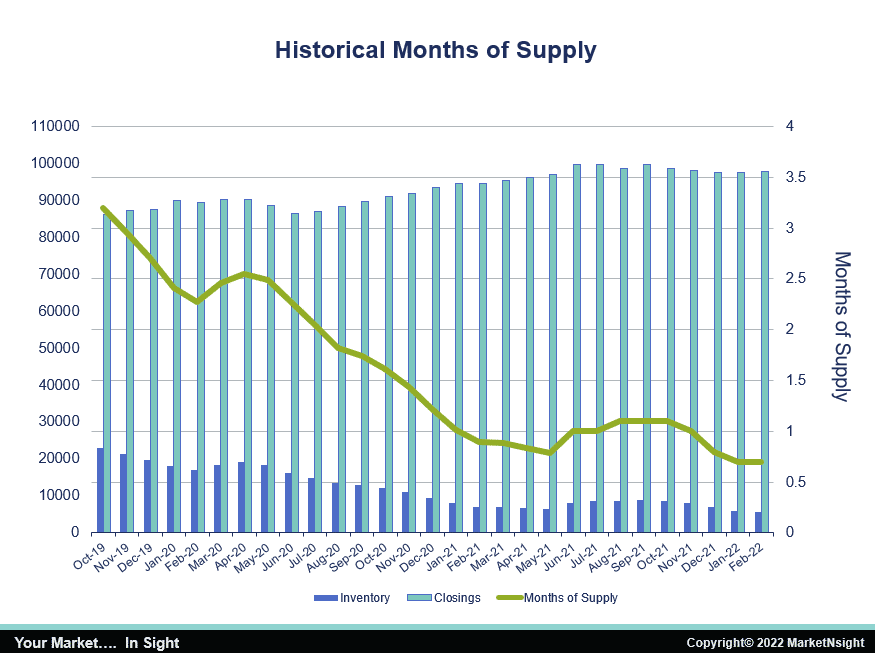
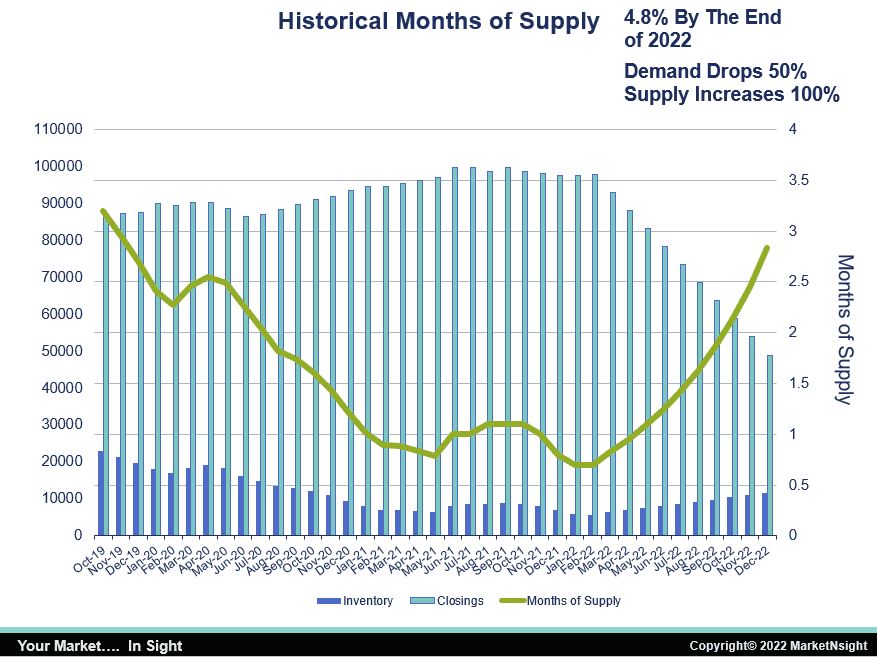
Chart 3 shows where we are as of February 2022, back at 0.7 months of supply. Playing out two scenarios for the rest of 2022 shows just how deep the supply deficit really is.
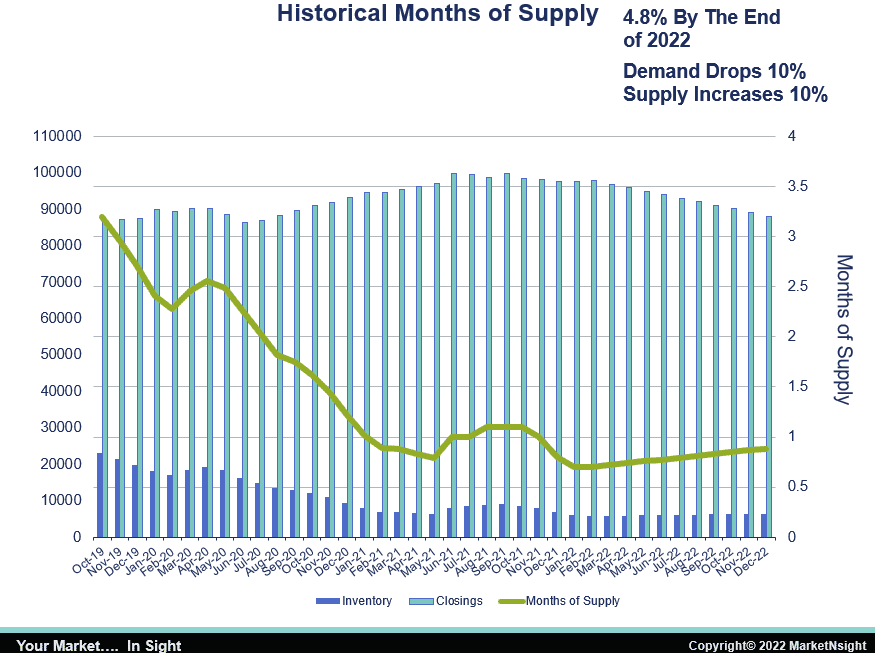
The first scenario assumes 30-year rates will hit 4.8% by the end of this year, causing a 10% decrease in demand and a 10% increase in supply. This is the same thing the Atlanta housing market experienced in 2018.
“As you can see, this would not even move the needle on months of supply, still leaving us with less than one month,” Hunt said.
The second scenario assumes a radical drop in demand that is not likely to occur. Even if demand is cut in half and inventory doubles by the end of this year, Atlanta would still have under three months of supply.
If scenario two had occurred in 2019, when there was 430% more inventory on hand, it would have pushed months of supply to 13 and resulted in an annual inventory surplus of over 45,000 homes. This is the difference that near-zero inventory makes.
“After a decade of underbuilding, and especially underdeveloping, we find ourselves in an inventory crisis of epic proportions,” Hunt said. “For this reason, we believe any effect from rates rising even as high as 5% will be relatively muted.”
To learn more or to schedule a demonstration, visit www.MarketNsight.com.
About MarketNsight:
MarketNsight is focused on helping its customers make smart decisions as it relates to purchasing land and pricing product. Its groundbreaking Feasibility Matrix provides a one-stop-shop for gauging new home community feasibility by providing ranking reports, lot and raw land sales data, regression analysis and mortgage data.
MarketNsight currently serves 35+ cities in seven states – Alabama, Florida, Georgia, North Carolina, South Carolina, Tennessee, Texas and Virginia. Look for the addition of more cities soon!
To schedule a demonstration of the MarketNsight Feasibility Matrix® or Mortgage Matrix®, call 770-419-9891 or email info@MarketNsight.com. For information about MarketNsight and Hunt’s upcoming speaking engagements, visit www.MarketNsight.com.
As always the best of the best when it comes to analyzing the housing market yesterday, today and for tomorrow.